
Learn to setup InfluxDB, Telegraf, and Grafana on Docker in Part 1 of this series. Get started with InApps.net today!
In Part 1 of this tutorial series, we cover the steps to install InfluxDB 1.7 on Docker for Linux instances. Then later, we will describe in Part 2 how to install the Telegraf plugin for data-collection and the Grafana interface with InfluxDB 1.7 and Docker. To note, InfluxDB will soon become InfluxDB 2.0, which will serve as a a single platform to manage all the components of the TICK Stack. Another tutorial about how to install and set up will be coming soon for InfluxDB 2.0 is coming soon. Before you begin, it is important to ensure that all the prerequisites are met to install InfluxDB on Docker.
Key Summary
- Objective: The article provides a step-by-step guide to configure a monitoring stack using InfluxDB (time-series database), Telegraf (data collection agent), and Grafana (visualization platform) on Docker for efficient system monitoring.
- Key Components: InfluxDB: Stores time-series data (e.g., metrics, logs) with high performance for real-time analytics. Telegraf: Collects and sends metrics from various sources (e.g., system, applications) to InfluxDB. Grafana: Creates interactive dashboards to visualize data stored in InfluxDB.
- InfluxDB: Stores time-series data (e.g., metrics, logs) with high performance for real-time analytics.
- Telegraf: Collects and sends metrics from various sources (e.g., system, applications) to InfluxDB.
- Grafana: Creates interactive dashboards to visualize data stored in InfluxDB.
- Setup Process: Prerequisites: Install Docker and Docker Compose on the host system (e.g., Linux, macOS, or Windows). Docker Compose Configuration: Create a docker-compose.yml file to define services for InfluxDB, Telegraf, and Grafana, specifying images, ports, volumes, and environment variables. InfluxDB Setup: Configure a container with a database, user, and password; expose port 8086 for data ingestion. Telegraf Configuration: Set up a Telegraf container to collect system metrics (e.g., CPU, memory) and send them to InfluxDB; customize telegraf.conf for input/output plugins. Grafana Setup: Run a Grafana container, expose port 3000, and connect it to InfluxDB as a data source for dashboard creation. Run the Stack: Use docker-compose up to start all services, ensuring containers communicate via a shared Docker network.
- Prerequisites: Install Docker and Docker Compose on the host system (e.g., Linux, macOS, or Windows).
- Docker Compose Configuration: Create a docker-compose.yml file to define services for InfluxDB, Telegraf, and Grafana, specifying images, ports, volumes, and environment variables.
- InfluxDB Setup: Configure a container with a database, user, and password; expose port 8086 for data ingestion.
- Telegraf Configuration: Set up a Telegraf container to collect system metrics (e.g., CPU, memory) and send them to InfluxDB; customize telegraf.conf for input/output plugins.
- Grafana Setup: Run a Grafana container, expose port 3000, and connect it to InfluxDB as a data source for dashboard creation.
- Run the Stack: Use docker-compose up to start all services, ensuring containers communicate via a shared Docker network.
- Key Steps: Pull official Docker images for InfluxDB, Telegraf, and Grafana from Docker Hub. Mount persistent volumes to retain InfluxDB data and configurations. Access Grafana’s web interface (http://localhost:3000) to set up dashboards and visualize metrics.
- Pull official Docker images for InfluxDB, Telegraf, and Grafana from Docker Hub.
- Mount persistent volumes to retain InfluxDB data and configurations.
- Access Grafana’s web interface (http://localhost:3000) to set up dashboards and visualize metrics.
- Benefits: Scalable, containerized setup simplifies deployment and management. Real-time monitoring of system performance with customizable visualizations. Portable across environments due to Docker’s consistency.
- Scalable, containerized setup simplifies deployment and management.
- Real-time monitoring of system performance with customizable visualizations.
- Portable across environments due to Docker’s consistency.
- Best Practices: Secure the stack with strong passwords and restricted network access. Test configurations locally before production deployment. Monitor container health and logs using Docker commands.
- Secure the stack with strong passwords and restricted network access.
- Test configurations locally before production deployment.
- Monitor container health and logs using Docker commands.
- Context: Part 1 focuses on initial setup and configuration; subsequent parts (not covered) likely address advanced features like scaling or plugin customization.
Sudo Privileges
First of all, you need to have sudo rights on your Linux machine; otherwise, you won’t be able to install InfluxDB on your host.
To verify it, run the following command:
$ sudo -v
1 | $ sudo –v
If no error messages are shown on your terminal, you are good to go.
You now want to make sure that Docker is correctly installed on your system.
The tutorial “How To Install Docker on Ubuntu 18.04 and Debian 10” offers thorough details on how to correctly set up Docker on Linux. Once again to verify that Docker is correctly installed, you can run the following command:
$ docker –version
Docker version 19.03.1, build 74b1e89
Now that Docker is ready, let’s have a quick look at the networking strategy we are going to use for our containers.
Designing the Network Strategy for InfluxDB
Before you begin, it is important to review a few details about networking. By default, newly created containers run on the bridge network stack. In addition, after you install InfluxDB, it will be exposed to useful ports (such as port 8086) on your network stack. Later, you can also bind Telegraf to it, but Telegraf does not have to expose any ports to your current host stack. We will eventually run InfluxDB on the default bridge network, and have Telegraf running in the same stack as InfluxDB. In addition, we will add Grafana to our bridge network in order to visualize metrics gathered by Telegraf. As mentioned above, we will provide more details about setting up Telegraph in Part 2 of this series.
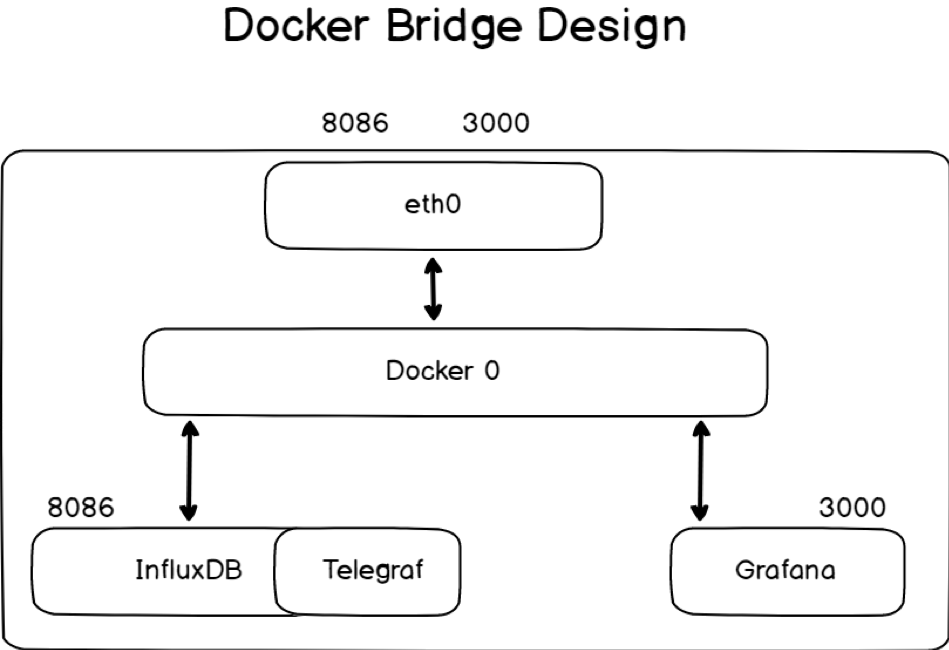
Now that we have seen the network strategy we are going to use, let’s install the InfluxDB container for Docker.
To install InfluxDB on Docker, you have two ways of doing it.
Read More:
Beginner's Guide To Java - 2022
You can prepare your filesystem manually, and run the InfluxDB on a Docker container with no initialization scripts. This is the simplest way to initialize InfluxDB. This method should be used if you plan on running InfluxDB on a single instance, and if your initial InfluxDB configuration is very simple, or if you prefer to have full control over your containers.
However, there is a way to initialize InfluxDB with scripts (either bash scripts, or InfluxQL scripts). You should do this if you are automating a lot of servers with InfluxDB (with Chef or Puppet for example), and you want to have the same initial setup on all your instances.
Installing InfluxDB 1.7.x on Docker
The official InfluxDB image for Docker is called influxdb.
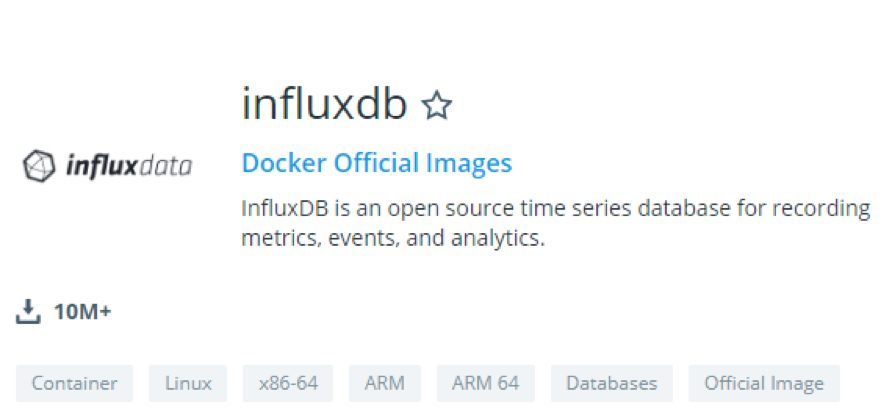
This InfluxDB image is part of the Official Docker Images, so you can rest assured that you are running an official version of InfluxDB on your system. Moreover, the other tools of the TICK Stack (Telegraf, InfluxDB, Chronograf and Kapacitor) are also a part of the Official Docker Images.
The InfluxDB image will install the InfluxDB server responsible for storing time-series metrics on your system.
If you are familiar with Docker, you already know that you can map volumes from your local filesystem to your container in order to manipulate data easier in your container. This is exactly what we are going to do in this tutorial.
Configuration files, as well as directories storing actual data, will be stored on our local filesystem.
Prepare InfluxDB 1.7.x for Docker
If you carefully followed the tutorial on setting up InfluxDB on Ubuntu, you know that you are going to create a specific user for your InfluxDB database.
$ sudo useradd -rs /bin/false influxdb
1 | $ sudo useradd –rs /bin/false influxdb
In your etc directory, create a new folder for your InfluxDB configuration files.
$ sudo mkdir -p /etc/influxdb
1 | $ sudo mkdir –p /etc/influxdb
Creating a Configuration File for InfluxDB and Docker
Luckily, you don’t have to create an InfluxDB configuration file by yourself. To create an InfluxDB configuration file using Docker, run the following command:
docker run –rm influxdb influxd config | sudo tee
/etc/influxdb/influxdb.conf > /dev/null
As a quick explanation, the influxd config command will print a full InfluxDB configuration file for you on the standard output (which is by default your shell).
As the –rm option is set, Docker will run a container in order to execute this command and the container will be deleted as soon as it exits. Instead of having the configuration file printed on the standard output, it will be redirected to our InfluxDB configuration file.
Next, reassign the folder permissions for your newly created file; otherwise, your container won’t be able to interact with it properly.
$ sudo chown influxdb:influxdb /etc/influxdb/*
1 | $ sudo chown influxdb:influxdb /etc/influxdb/*
Creating a Lib Folder for InfluxDB and Docker
As stated in the documentation, InfluxDB stores its data, metadata as well as the WAL (for write-ahead log) in the /var/lib/influxdb folder by default.
As a consequence, you have to create this folder if it does not currently exist.
$ sudo mkdir -p /var/lib/influxdb
1 | $ sudo mkdir –p /var/lib/influxdb
Again, make sure that the permissions are correctly set for your container to write into this folder.
$ sudo chown influxdb:influxdb /var/lib/influxdb
1 | $ sudo chown influxdb:influxdb /var/lib/influxdb

Now that our folders are ready, let’s see how we can initialize InfluxDB with custom scripts.
Sponsor Note

InfluxData delivers a complete open-source platform built specifically for metrics, events, and other time- based data — a modern time-series platform. Whether the data comes from humans, sensors, or machines, InfluxData empowers developers to build next-generation monitoring, analytics, and IoT applications faster, easier, and to scale delivering real business value quickly.
Preparing Initialization Scripts for InfluxDB on Docker (optional)
With the InfluxDB image, there is a way to automate the database initialization on your containers. As an example, we will instruct our Docker container to create an administrator account, a regular user account (for Telegraf), and a database with custom retention via a custom InfluxQL script.
Anatomy of the InfluxDB image
On container boot, the entrypoint.sh script is executed, it is set as the entrypoint of your Docker container.
The entrypoint can be executed in two ways.
You can execute the entrypoint script in order to launch a simple InfluxDB instance on your container. This is for example what we have done in the previous section. We specified the configuration flag, and it was used in order to set your InfluxDB server initialization.
However, there is a second way to execute the entrypoint script: by executing the init-influxdb script.
The init-influxdb script is made of two parts:
- First, it will watch for environment variables passed to your docker command, and it will execute commands accordingly.
- Next, if you have a docker-entrypoint-initdb.d directory at the root directory of your container, it will execute either bash scripts or IQL scripts in it.
We are going to use this information to create our InfluxDB container.
First, make sure that no folders are already created in your /var/lib/influxdb folder.
$ ls -l /var/lib/influxdb
total 0
Execute the following command for the meta folder (in the influxdb folder) to be updated with the correct information. As a reminder, we want an admin account and a regular account for Telegraf (named telegraf).
Read More:
Update Monitoring and Microservices
Creating Initialization Scripts on Your Host
In order for the initialization scripts to run on initialization, they have to be mapped to the docker-entrypoint-initdb.d folder in your container.
First, create a scripts folder on your host wherever you want. In my case, it is going to be created in
/etc/influxdb.
$ sudo mkdir -p /etc/influxdb/scripts
CREATE DATABASE weather;
CREATE RETENTION POLICY one_week ON weather DURATION 168h REPLICATION 1 DEFAULT;
This a simple initialization script that will create a database for weather data, and it will assign a one-week retention policy for the database.
Great!
The last step will be to prepare our meta folder for InfluxDB initialization.
Creating/Updating the InfluxDB Meta Database
In order to update your meta database, run the following command:
$ docker run –rm -e INFLUXDB_HTTP_AUTH_ENABLED=true
-e INFLUXDB_ADMIN_USER=admin
-e INFLUXDB_ADMIN_PASSWORD=admin123
-v /var/lib/influxdb:/var/lib/influxdb
-v /etc/influxdb/scripts:/docker-entrypoint-initdb.d
influxdb /init-influxdb.sh
Note: Setting the INFLUXDB_HTTP_AUTH_ENABLED to true does not mean that authentication is enabled on your InfluxDB server.
Authentication is enabled in one of the next sections; this parameter is only used for the initialization script.
Please make sure that you have a couple of logs printed to your terminal. If this is not the case, make sure that you specified the correct environment variables for your container.
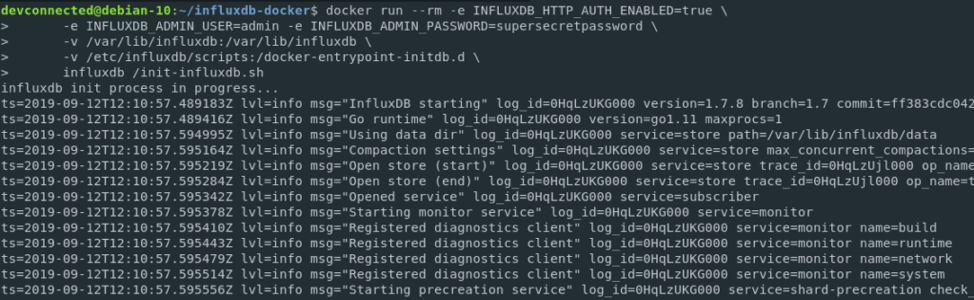
If you chose to create initialization scripts for your container, you should also have a logline for it.

As the last verification step, you can inspect your meta.db file in your meta folder to make sure that the changes were correctly written.
$ cat /var/lib/influxdb/meta/meta.db | grep one_week
1 | $ cat /var/lib/influxdb/meta/meta.db | grep one_week

Now that your InfluxDB files are prepared, let’s head over to some configuration verifications.
Verifying Your InfluxDB Configuration for Docker
If you used the configuration command detailed in the section above, you should be presented with a simple configuration file in the /etc/influxdb folder. Open your file and verify that everything is correct.
HTTP Interface
Head over to the [http] section of your configuration and make sure that it is enabled.
Verify that the bind-address is set to 8086 by default. This is the port that you are going to use to send some commands to your InfluxDB database, like creating a database or adding a user for example.
By default, authentication and encryption are disabled. However, sections of this tutorial explain how you can set up authentication in depth.
Data, Meta and WAL configurations
By default, your configuration file should have the paths that we created in the first section, so you don’t have to change anything. However, you should check that your paths are correct.
[meta]
dir = “/var/lib/influxdb/meta”
[data]
dir = “/var/lib/influxdb/data”
wal-dir = “/var/lib/influxdb/wal”
Running the InfluxDB container on Docker
We are going to use the InfluxDB image from the official Docker repositories. As a quick reminder, you need to use the docker container run command in order to start a Docker container.
First, make sure that nothing is running on the port 8086:
$ sudo netstat -tulpn | grep 8086
1 | $ sudo netstat –tulpn | grep 8086
If you remember correctly, we configured our folders to be accessible by the InfluxDB user (belonging in the InfluxDB group). As a consequence, we will need the user ID of the InfluxDB user in order to run our container.
To find the InfluxDB user ID, head over to the passwd file on your host and run:
$ cat /etc/passwd | grep influxdb
influxdb:x:997:997::/var/lib/influxdb:/bin/false
As you can see, the user ID for my InfluxDB user is 997.
Note: the user ID will surely be different on your system, and you should modify it accordingly when running the docker command.
To start InfluxDB on Docker, run the following command:
docker run -d -p 8086:8086 –user 997:997 –name=influxdb
-v /etc/influxdb/influxdb.conf:/etc/influxdb/influxdb.conf
-v /var/lib/influxdb:/var/lib/influxdb
influxdb
-config /etc/influxdb/influxdb.conf
Testing Your InfluxDB Container
In order to test if your InfluxDB container is correctly running, you can check that the HTTP API is correctly enabled:
$ curl -G http://localhost:8086/query –data-urlencode “q=SHOW DATABASES”
1 | $ curl –G http://localhost:8086/query –data-urlencode “q=SHOW DATABASES”

$ netstat -tulpn | grep 8086
tcp6 0 0 :::8086 :::* LISTEN –
Awesome! Your InfluxDB container is correctly running on Docker.
Read More:
How eBay Pivoted to Apple Silicon with the Help of an Agile Code Base – InApps 2022
By default, your InfluxDB server does not contain any databases except for the _internal used, as its name describes, internal metrics about InfluxDB itself. However, if you created initialization scripts for your InfluxDB database, make sure that your databases and retention policies are correctly assigned.
$ influx
Connected to http://localhost:8086 version 1.7.8
InfluxDB shell version: 1.7.7
> SHOW USERS
user admin
—- —–
admin true
> SHOW DATABASES
name: databases
name
—-
weather
Enabling Authentication on InfluxDB for Docker
In order to enable authentication for InfluxDB 1.7.x, you are going to create an administrator account for your InfluxDB database (if you didn’t use initialization scripts)
Create an Administrator Account with Docker exec
You don’t have to create an administrator account if you initialized your InfluxDB image with environment variables in the previous sections.
This is only necessary is you choose a fully customized InfluxDB image that you configure yourself.
To create an administrator account, connect to a bash process in your container and run the influx utility by yourself.
To achieve ths, run the following commands:
$ docker container ls
1 | $ docker container ls

Enabling authentication on InfluxDB for Docker
In order to enable authentication for InfluxDB 1.7.x, you are going to create an administrator account for your InfluxDB database (if you didn’t use initialization scripts)
Create an administrator account with docker exec
You don’t have to create an administrator account if you initialized your InfluxDB image with environment variables in the previous sections.
This is only necessary is you choose a fully customized InfluxDB image that you configure yourself.
To create an administrator account, connect to a bash process in your container and run the influx utility with the following commands:
class=””>$ docker container ls
1 | class=“”>$ docker container ls

Note: If your container is not appearing here, then run this command with the -a (for all) flag to make sure that your container hasn’t crashed.
Identify the container ID of your InfluxDB container, and run the following command to have a bash in your container:
$ docker exec -it
1 | $ docker exec –it <container_id> /bin/bash
As a reminder, the docker exec is used in order to run a command in a running container.
Here are the options specified with it:
- -i : for interactive, it will keep the standard input open even if not attached
- -t : to allocate a pseudo-TTY to your current shell environment.
Right now, you should have a shell prompt, similar to this:

In your container, run the influx utility to create your administrator account.
$ influx
Connected to http://localhost:8086 version 1.7.8
InfluxDB shell version: 1.7.8
> CREATE USER admin WITH PASSWORD ‘admin123’ WITH ALL PRIVILEGES
> SHOW USERS
user admin
—- —–
admin true
Now that you have an administrator account, you can enable the HTTP authentication for your database:
Enable HTTP Authentication in Your Configuration File
Now, head over to the configuration folder you created for InfluxDB:
Ctrl + D (to exit your container)
1 | Ctrl + D (to exit your container)
$ sudo nano /etc/influxdb/influxdb.conf
1 | $ sudo nano /etc/influxdb/influxdb.conf
[http]
enabled = true
bind-address = “:8086″
auth-enabled = true
Save your file and restart your container for the changes to be applied:
$ docker container restart
1 | $ docker container restart
$ curl -G http://localhost:8086/query –data-urlencode “q=SHOW DATABASES”
{“error”:”unable to parse authentication credentials”}
$ curl -G -u admin:admin123 http://localhost:8086/query –data-urlencode “q=SHOW DATABASES”
{“results”:[{“statement_id”:0,”series”:[{“name”:”databases”,”columns”:[“name”],”values”:[[“_internal”]]}]}]}
With this curl command, we made sure that our credentials were correctly set up for our InfluxDB server.
Now that your time-series database is up and running, it is time to install our metrics collection agent: Telegraf. In Part 2, we describe how to install the Telegraf plugin as a data-collection interface with InfluxDB 1.7 and Docker.
InApps Technology is a wholly owned subsidiary of Insight Partners, an investor in the following companies mentioned in this article: Docker.
Related Articles

Best Countries to Outsource Software Development (2026 Guide)
Software development outsourcing means hiring an external engineering team - usually based in another country- to design, build, or maintain software on your behalf, instead of hiring in-house. Most US, UK, and Australian companies do this to access skilled engineers faster and at a lower fully-loaded cost than domestic hiring allows.

How to Hire Remote Developers Without Losing Code Quality: A 2026 Playbook for CTOs
Every CTO who hires remote developers eventually asks the same question: how do I know this is going to work before I've sunk three months and a sprint's worth of technical debt into finding out? Most guides to hiring remote developers answer a different question: which platform to use. They skip the part that actually determines whether the code that comes back is any good. This playbook covers the vetting mechanics, engagement models, and real rate data behind hiring remote engineers who ship production-quality code from week one, not another list of freelance marketplaces.

IT Managed Services vs Break-Fix IT Support: What Growing Startups Need in 2026
Break-fix IT feels free right up until the week something breaks in production and there is no one already watching for it. Here is how growing startups actually decide between break-fix support and managed services in 2026, and why the decision has gotten sharper for anyone shipping a product built quickly with AI tools.