
Big data is a treasure trove for all types of companies. Every company deserves the best Big Data data analysis and visualization tool. In this post, we will try to provide you with as much detail as possible about the best BI tool for Big Data Visualization. In this segment, we will compare Tableau vs Power BI vs Qlik Sense.
Now if you’re considering whether a business intelligence (BI) tool could be a sound addition to your organization, you’ve probably already gotten some background on what they can do. The question is, which one would be the best fit? While every BI tool helps businesses connect data with insights, each one will take a different approach to make that happen.
Your organization might only need a business intelligence tool that focuses on data visualization, or maybe you need a more end-to-end platform. Whatever the situation, some capabilities will likely be more essential to your organization than others, so it only makes sense to look at the Top BI tools side-by-side.

Top Business Intelligence Tools
What is Tableau?
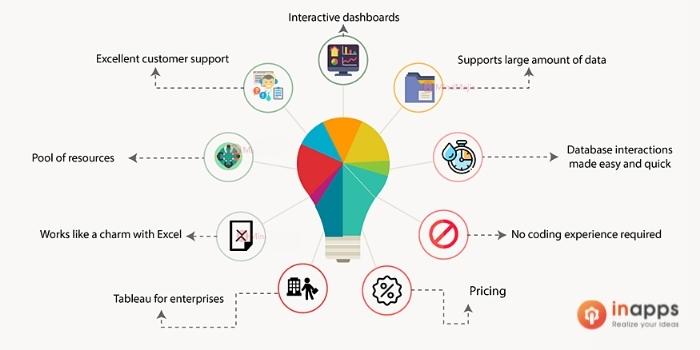
Tableau is one of the leading and most popular business Intelligence Tools. It has the best perception abilities with an ideal front-end graphical UI. It additionally has some underlying examination modules which can be utilized by the users directly on their data.
Organizations with smaller budgets often use Google Data Studio which is free. However, Google Data Studio does have some significant drawbacks when it is compared with Power BI.

Features of Tableau
- It has an efficient drag and drops feature.
- Tableau Public is used for data sharing.
- It uses the web to incorporate collaborative data visualizations.
- Its output is high and dependable, and they work with massive amounts of data.
- It is mobile-friendly and can be accessed via complete online versions.
What is Microsoft Power BI?
Power Bi is a Microsoft-powered data visualization tool. Power BI turns out to be superior to the rest here as it works out best with Microsoft Azure and Microsoft cloud environment. One of the best features of software users find in you can export all the data to excel and can also personalize data dashboards.

Features of Power BI
- Rich graphical visualizations derived from complex BI data.
- Ad-hoc Reporting
- Excellent Navigation Pane
- Features a dataset of customizable dashboards.
What is Qlik Sense?
Qlik Sense is an intelligent data visualization tool that empowers clients to import and accumulate data from Bi sources. One of the features is that you can use data visualization tools as software to shape raw data into meaningful information.

Features of Qlik Sense
- Using a hybrid method, the user may connect data stored in large sources with the Qlik view in-memory dataset.
- It enables users to conduct business discovery and visual analysis with the aid of direct discovery.
- Mobile-friendly, Permissions and Roles
- Interact with live applications and dashboards.
Tableau vs Power BI vs Qlik Sense – A Detailed Comparison
The data engine
There’s more than one way for data analysis software to get the job done, so make sure you pick a BI tool that gives the kinds of solutions you’re looking for. Most data engines give solutions based on linear search patterns, so the results tend to be predictable. Other data engines take a broader approach, analyzing multiple sources of data before delivering solutions.
| Tableau | Power BI | Qlik Sense |
| They operate over an SQL database, meaning the queries follow a pre-defined linear path. | They also work on an SQL database, so the solutions are usually straightforward and based on a limited amount of data. | Their data engine is associative rather than query-based, so all your data can be explored and you get to see connections and patterns that narrower sets of data wouldn’t have shown. |
Embedded analytics
If you’re incorporating a BI tool into your organization, it will have to be integrated into workflows that are already well-established. BI tools have numerous capabilities, so making them a natural part of the workflow is crucial to prevent constant interruptions. By using robust embedded analytics for applications, portals, and processes, users can improve their insights without losing efficiency.
| Tableau | Power BI | Qlik Sense |
| Their embedded analytics can be used across a variety of applications and processes, but users will only be able to embed entire dashboards. | They offer not only embedded dashboards but a range of other objects as well. | The objects that are available for embedding include metrics, individual values, dashboards, and numbers, and they work smoothly across a wide range of scenarios. Users can take advantage of embedded analytics on their edge devices, portals, products, and more. |
Broad use cases
Just like embedded analytics, having broad use cases is essential for maintaining user efficiency while giving them in-depth insights. Users shouldn’t just have analytical tools embedded across their workflows; those tools should support a variety of use cases. Whether they need to perform data exploration, look at detailed graphs, or view augmented analytics, users need broad use cases for optimum performance.
| Tableau | Power BI | Qlik Sense |
| Their use cases are oriented around data visualization, which is fairly limited compared to other BI tools. They’re supposed to be simple enough for the average user, but skilled business authors might be more comfortable using this feature. | Just like several other Power BI capabilities, various Microsoft products are required before the BI platform can deliver on the range of available use cases. For organizations that already use an array of Microsoft products, this could feel like an organic addition to user workflows. | All users in your business can do different activities (like data analysis, embedded analytics, or creating interactive dashboards) on the same platform with a common analytics engine, AI capabilities, and analytics data pipeline. |
Central data management
A BI tool should allow free user access to data, but also have measures in place to minimize data pollution. The favored model is to maintain a central server, where user-created content is validated by IT; where these three BI tools diverge is how users can access and work with data. Working from a desktop means more flexibility for users, but there’s also a greater risk of user error; working on a server with everyone else makes validation easier, but users won’t be able to work offline.
| Tableau | Power BI | Qlik Sense |
| Work is done on users’ hard drives, so they’re able to work even when they’re offline. Once it’s completed, they send everything to the central server for validation. | Users can build workbooks on their own desktops, and then share the workbooks on the cloud. Like with Tableau, users can work offline. | Instead of working on individual desktops, users create content in the cloud, where IT can easily manage the content as it’s being generated. As a result, there’s a smaller chance of polluted or outdated content being circulated. |
The cloud solution
What kind of cloud solution does your organization have? It could be public or private, unlimited or already maxed-out. There might even be on-premise servers, ready to accommodate a new BI platform and all the associated data. Whatever cloud solution your organization has, there’s a BI tool that can fit right in.
| Tableau | Power BI | Qlik Sense |
| There’s only one cloud storage option, which is provided by Salesforce. This could work well for organizations that don’t have much extra space in the cloud or on-premise. | Organizations can deploy this platform from their on-premise servers, or from Microsoft’s Azure cloud solution. Each storage option will deliver different functionalities, so that’s one thing to consider when choosing where to store your data. | This platform is cloud-agnostic, so it can be deployed from both private and public servers. On-premise servers are an option as well, or any combination of the three. |
Why Tableau is better than other BI tools? Is Tableau the best BI tool?
Why Tableau is better than other BI tools?
Data Manipulation
As far as data manipulation is concerned, understanding data, pulling reports from databases, consolidating data into one place and the complexity of software deployment are major issues. Tableau is a magnificent business intelligence tool that is considered the best analytics tool as it helps with better implementation of data analytics.
Data Integration
Compatibility is not an issue as far as Tableau is considered as it allows building new integrations with any type of software and programming language to build data. Connecting data has never been so simple as the need for data entry is now taken away with the invention of Tableau.
Big Data Revolution
A business intelligence platform that helps resolve big data issues is required to be a key market player in the Big Data revolution. A Business Intelligence software is required to turn data into insights in a meaningful yet profitable manner. Tableau has many such advantages. The practice of viewing data in excel sheets has long been destroyed and is unmanageable due to large data coming in and out of databases. Tableau has invented a whole new era of the big data revolution.
Data Visualization
Keeping up a good user interface is key to any successful software or tool. The ease of use and visual representation of applications is as important as its functionality. Tableau is one of the biggest players in the market known for the best data visualization, making appealing visual representations of data. Creating simple KPI dashboards is an easy task with Tableau.
Data Import and Export
To eliminate the necessity of data entry, easy import and export of data must be plausible. Data revolves around any business intelligence software and Tableau knows how to make proper utilization of it. Supporting data sources from which data can be imported is a huge benefit that Tableau holds. With hundreds of possible data sources such as MySQL, JSON, SAP, and more, Tableau solves data import issues without a hassle.
Analytics Support
Incorporating advanced analytics in a tool is more than tedious as languages and technology keep updating themselves from time to time. Providing advanced analytics support today means providing outdated support tomorrow. Tableau includes support for both Python as well as R scripting, with various other tools and languages.
Pricing
With no hidden costs, Tableau starts its basic pricing range at $35 per user per month and allows a free trial. Although there are cheaper options to consider, Tableau scores brownie points for its features and other business intelligence support.
Dealing with both on-premise as well as cloud-based services, Tableau helps customers solve their business analytics worries by centrally managing data. Connecting to a wide range of data sources and allowing data access from anywhere, anytime, Tableau helps set Business Analysts and Data Analysts on the right track.
Wrapping up on Tableau vs Power BI vs Qlik Sense
When compared to Tableau, Qlik Sense has superior access control and general security abilities. Data is secured at the row, column, and table levels by the Qlik data analytics platform. Tableau, on the other hand, can only secure data at the row level and access at the workbook level.
The Tableau platform is well-known for its data visualization capabilities, while Power BI provides multiple data points for data visualization. Tableau BI can accommodate a large amount of data with higher performance, while Power BI can only handle a small amount of data.
Qlik and Tableau support the majority of the same data connectors, but the way they sort data is where they vary the most. Qlik employs an associative engine to aid in the discovery of insights that would otherwise be lost due to human error, while Tableau displays data via a query-based approach.
Tableau is commonly regarded as one of the best reporting methods for visual appeal. As a result, it serves as both a monitoring tool and a data visualization tool. It aids in the transformation of raw data into easily digestible graphics that both technical and non-technical users can understand.
What’s the next step?
Choosing a business intelligence platform is a major decision, but at least now you know some of the most important capabilities to look for. Don’t just look for the platform that will fit your organization right now; think about which capabilities could drive future expansion in the next few years. The right BI tool will not only be a solid match now but will still be giving data-based insights years into the future.
Picking the right one necessitates thorough analysis. Tableau is a market leader due to its drag-and-drop features and stable data connections. Qlik’s attributes include its in-memory engine’s ability to visualize patterns. Reports created with Power BI can be shared across teams and accessed from any computer. Generally speaking, among the three tools, Power BI emerges as the competitor’s resource. It consists of high-level Microsoft applications and platforms, as well as specialized cloud platform support. Tableau is the preferred alternative in the existing business analysis industry.
Looking to hire well-experienced professionals? Go to InApps right now to find yourself some of the most well-versed individuals in the industry.

Let’s create the next big thing together!
Coming together is a beginning. Keeping together is progress. Working together is success.