InfluxData sponsored this post.

In public transportation, there’s little room for error when it comes to passenger safety. At the same time, rail operators don’t have bottomless financial resources to oversee their rail system. The team at BAI Communications in Toronto faced these two, diametrically opposed realities.
Fortunately, by using their existing network infrastructure, a time-series platform and a sizable helping of ingenuity, the BAI team was able to close that gap between their technical needs and cost. Here’s how they did it.
Background
BAI Communications is a global company and a leader in providing communications infrastructure, pioneering the future of advanced connectivity and delivering the ubiquitous coverage that can transform lives, power business ambitions and shape the future of our cities. The company focuses on three key verticals: broadcast, neutral host and 5G, and transit. It seeks to enrich lives by connecting communities and advancing economies.
BAI manages and operates the networking infrastructure for TCONNECT, the wireless network used by the Toronto Transit Commission (TTC). TCONNECT averages over 200,000 daily sessions, and over 5 million every month from approximately 100,000 unique devices every weekday. The TCONNECT network consists of more than 1,000 access points throughout Toronto’s 75 rail stations, over 72km of fiber, three data centers across the city and a large assortment of related networking hardware.
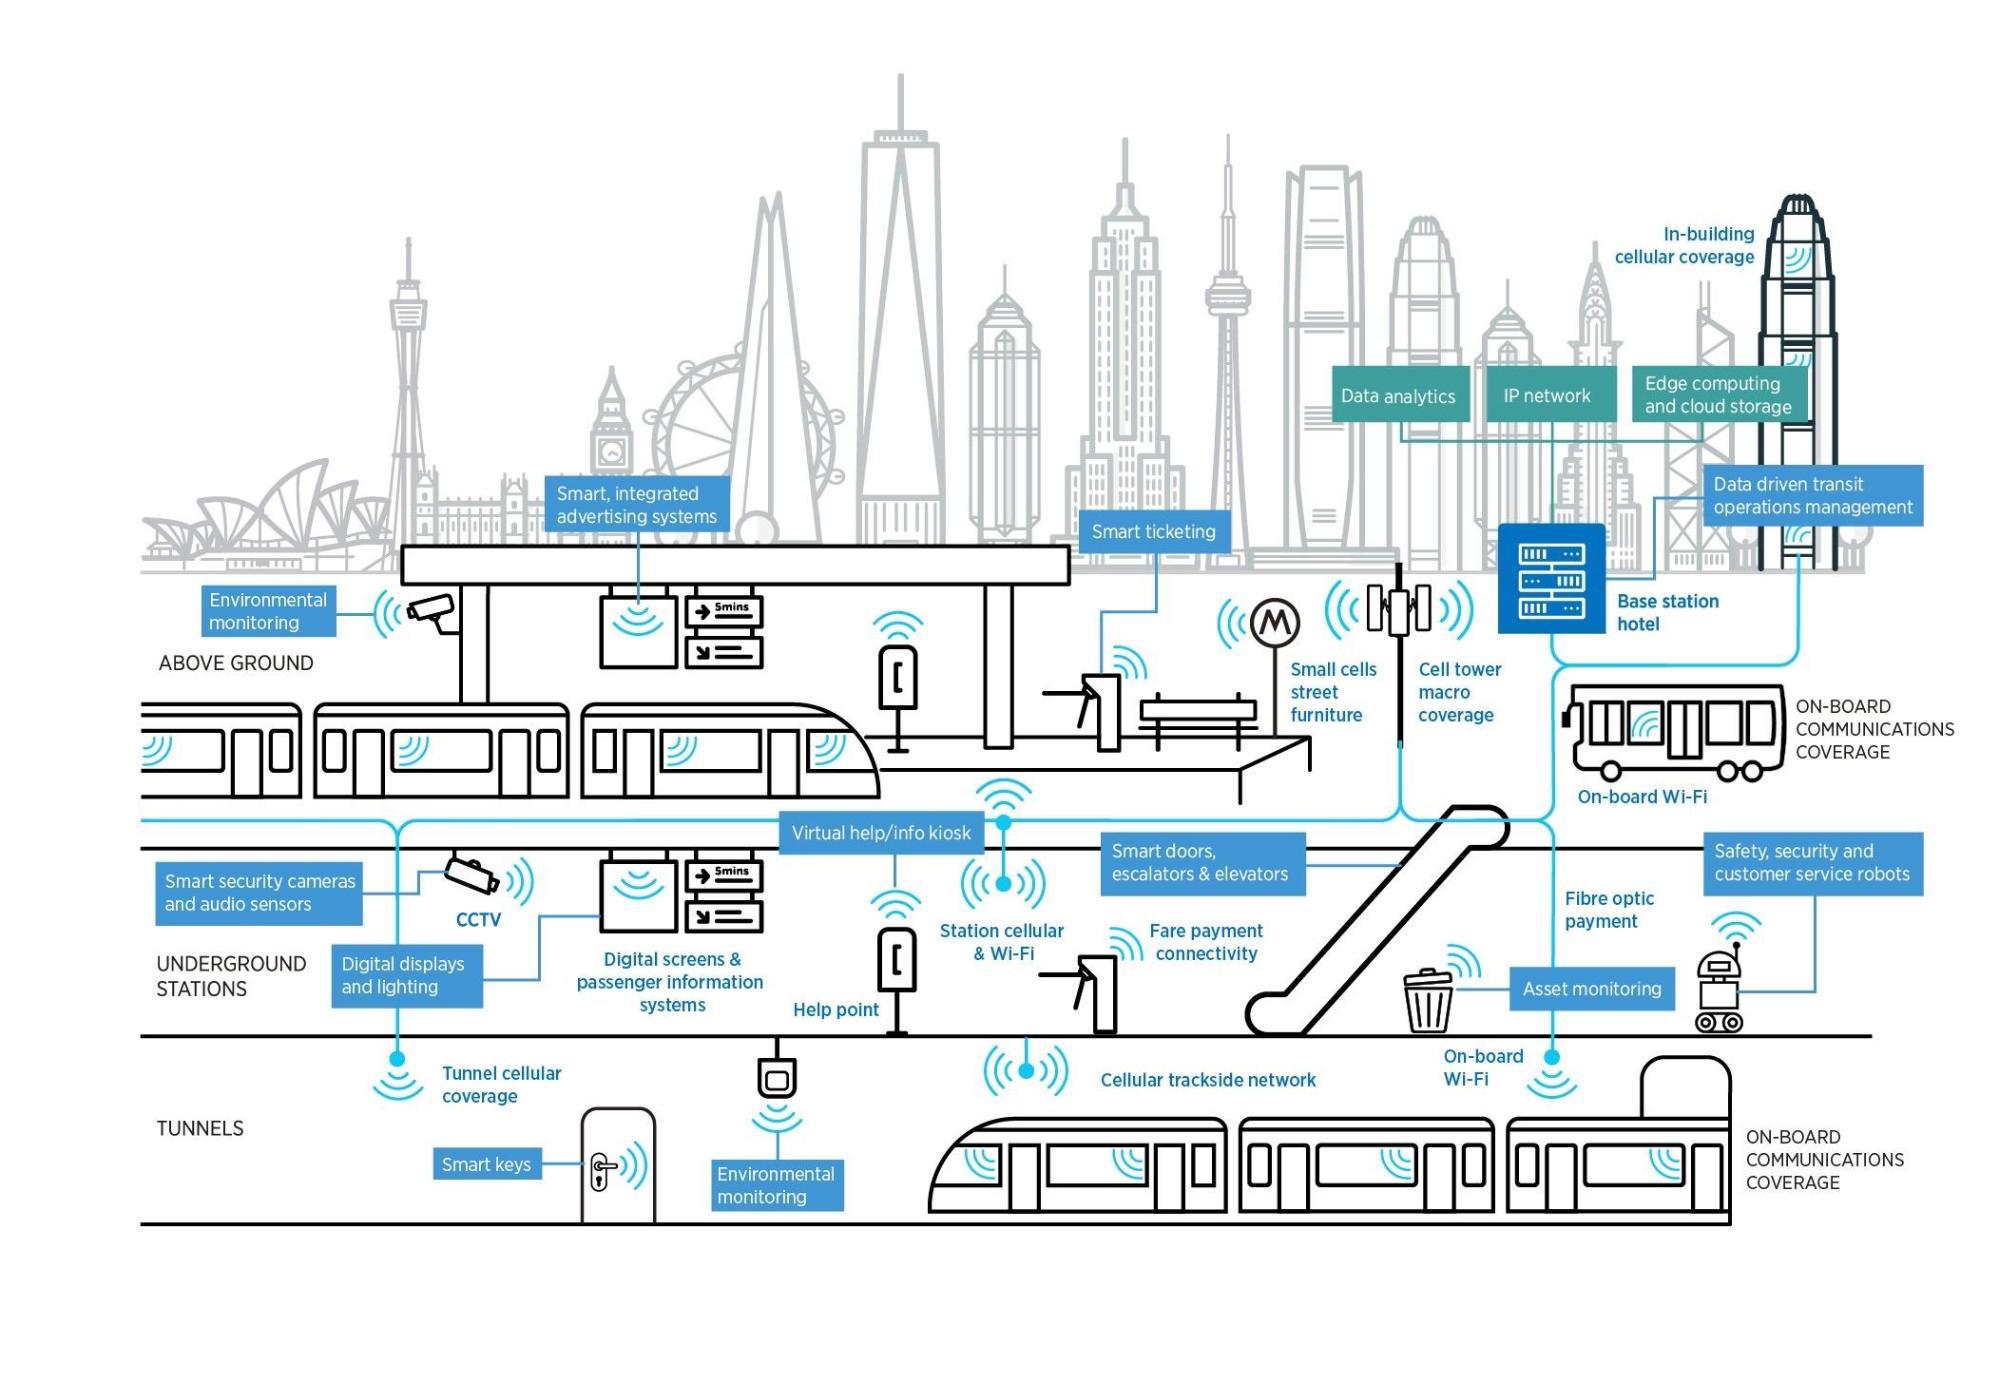
Click to enlarge image (opens in new tab); Source: BAI Communications
Introduction to InfluxDB
With a network of this size and scale, BAI directs a lot of attention to network performance and user experience. This is how the company first discovered InfluxDB time-series platform. The BAI team wanted to optimize the process for connecting to the network. They looked for a solution that would provide metrics on this process, but everything they found only looked at performance once the user established a connection.
Without a viable external solution, BAI built its own. Called Project Touchstone, the team used a Raspberry Pi and wrote a custom Python script that emulated the experience of their WiFi users and captured and timed every stage of the connection process. They selected InfluxDB as the place to store the data that Project Touchstone collected. Their experience with the platform was so positive that it quickly became the default time-series platform BAI used for all its time-series data needs.
Platform Crowding
High rider volumes can result in crowded train platforms. This creates a number of safety issues for rail operators, who used closed-circuit cameras and TVs to manually monitor station traffic levels. However, with a system of thousands of cameras, knowing when to look at specific feeds was challenging. By default, this was a reactive process that responded to on-the-ground reports or assumptions based on past anecdotal experience, like increased traffic after a sporting event.
The BAI team wanted to find a more reliable and accurate method to determine station foot traffic. They hypothesized that if they could identify rider locations, they could predict platform crowding. To test this theory, they used data science to conduct a study to determine whether a relationship existed between ridership and WiFi usage.
They compared the number of people entering the stations to the number of people connecting to the TCONNECT network and discovered a highly statistically relevant correlation of 0.9 between headcount and WiFi activity.

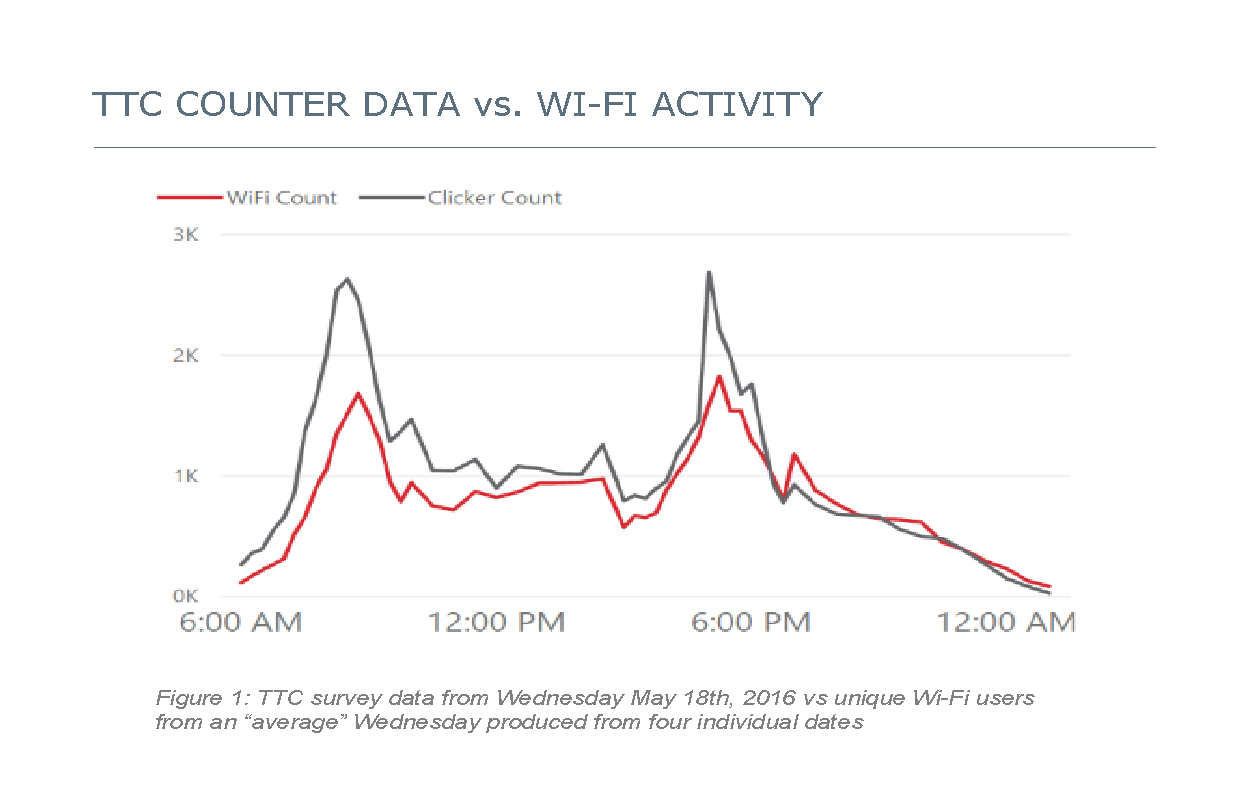
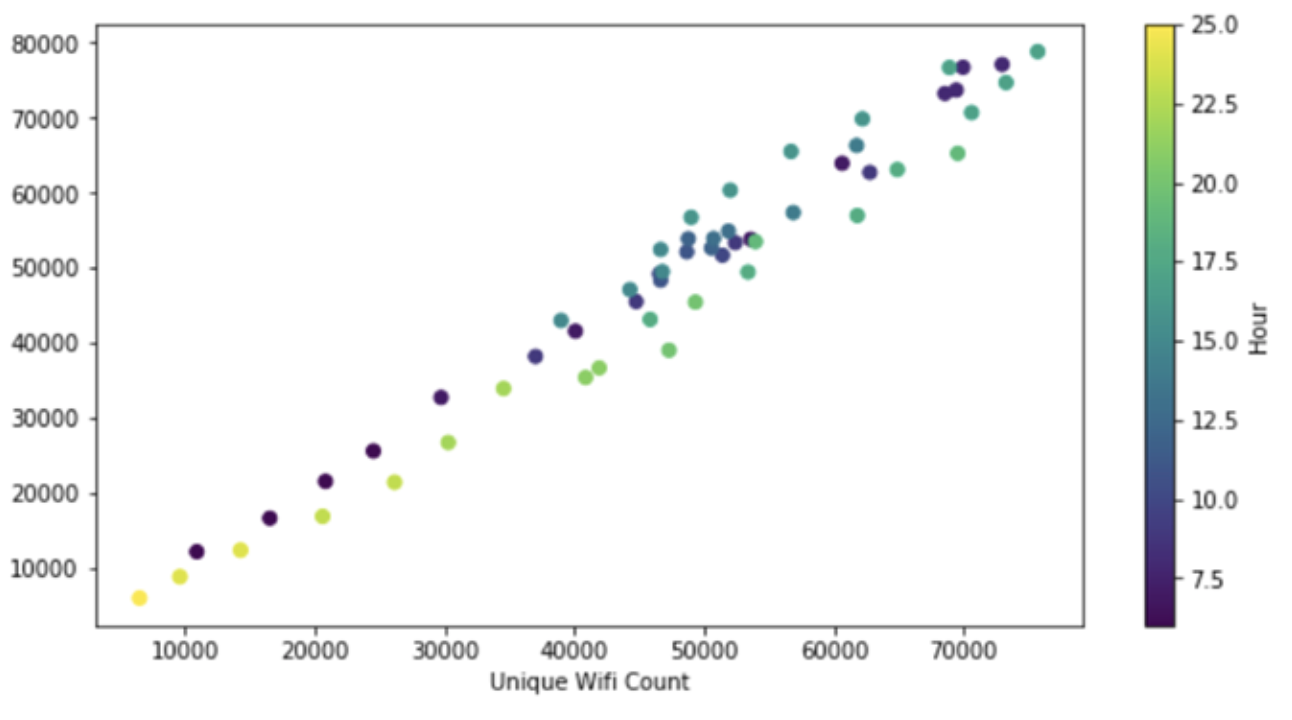
Source: BAI Communications
Armed with the knowledge that ridership correlated to WiFi usage, BAI began to develop a solution to understand platform crowding using the networking infrastructure already in place and WiFi analytics. Because they were able to show such a strong correlation, there was no need to add any additional sensors or hardware to the current infrastructure.
Data Management
The benefit of using WiFi analytics to determine station crowding was that it meant BAI could get this data using the networking hardware already in place. To accomplish this, they built a virtual machine that runs a Python script to scrape data from the access points and wireless controllers in each station. This script also adds any necessary tags to the data. BAI uses the tags to dynamically group the data. Then the script pushes the data into InfluxDB.
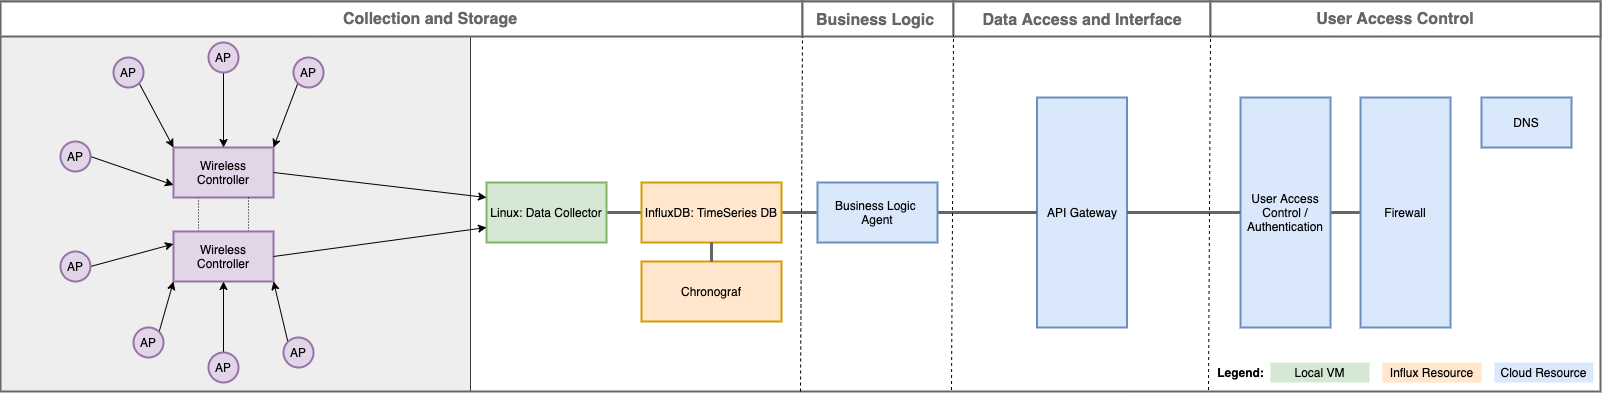
Source: BAI Communications | Data Pipeline
Visualizing Data
Once in InfluxDB, BAI can analyze and process that data and create visualizations to better understand it. For instance, looking at the data for a single rail station, usage spikes indicate when rail service starts in the morning, when the morning and evening rushes occur and when the rail service stops.

Source: BAI Communications | Trafficking in stations
A closer, more granular view of the data shows a regular pattern of peaks and valleys as riders enter and leave the station. This pattern is caused by riders’ devices trying to connect to the station WiFi once they reach the threshold of the station’s WiFi range. These occur at predictable intervals in accordance with the train schedule. A break in the pattern may indicate an issue.
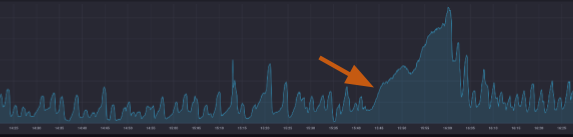
In the image above, the arrow indicates a probable service interruption because the number of people connecting to the station WiFi steadily increases over time. The data shows that it takes about 15 minutes before the station starts to clear out and 20 minutes for the rider volume to return to a normal level.
To more effectively use this data, BAI built a custom dashboard map of the Toronto rail system with InfluxDB as the backend. The map shows where in the network, in real time, passenger congestion and platform crowding issues occur.
If delays increase and start to spread across the network, rail operations staff can see those trends in real time and know instantly which stations and security cameras to focus on, which accelerates their triage and mitigation efforts.
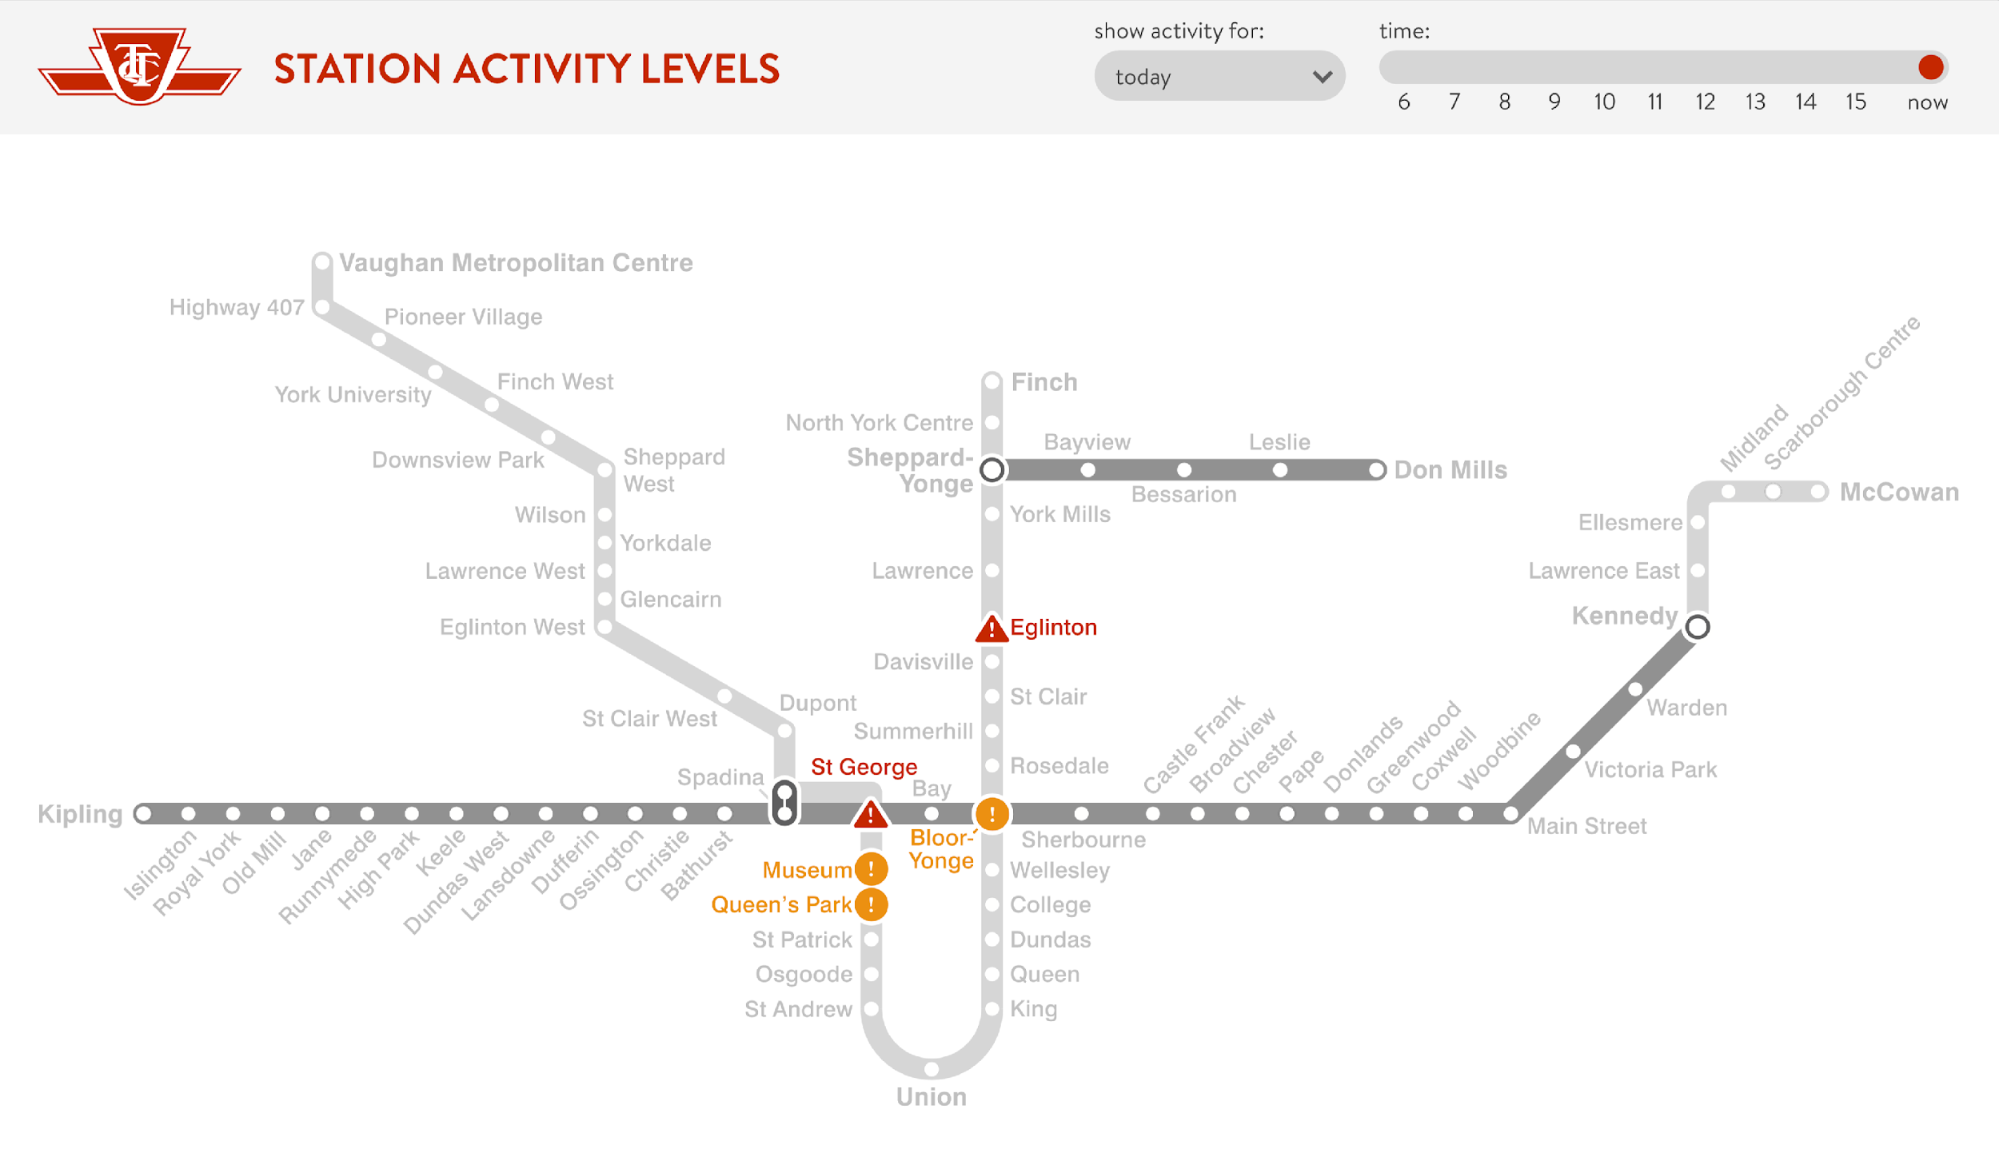
Source: BAI Communications | Real time view of traffic congestion
This solution completely reversed the order of operations for addressing platform crowding in Toronto rail stations. The old system relied on random CCTV monitoring or reports from employees on site. The new system automatically indicates to rail operators where an issue has the potential to occur, and they can then quickly view the CCTV feeds from those locations and start mitigation efforts. This ability to be proactive increases the safety of all rail customers.

Using InfluxDB, BAI Communications gained greater observability of its rail operations in Toronto. The success and effectiveness of this solution helped BAI expand its transit safety operations to New York City. Using data science and ingenuity, InfluxDB and existing networking infrastructure, BAI delivered a critical safety-tracking and alerting system requiring little cost to set up and manage.
To learn more about InfluxDB, visit www.influxdata.com.
InApps is a wholly owned subsidiary of Insight Partners, an investor in the following companies mentioned in this article: Real.
Photo by Andre Furtado from Pexels.