


Oracle sponsored this post.
Graph theory has been around for centuries, and graph analysis technology has existed for a few decades. So why is graph popularity soaring now?

Graph analytics is the process of analyzing data in a graph format, using data points as nodes and relationships as edges. Looking at data this way can help you discover connections and relationships that weren’t obvious before. This can unlock value in a vast number of circumstances. For example, graphs can help find fraud payments quickly, track sensitive data for compliance, discover outages in utilities networks, perform turnover analysis to keep valuable employees and track proteins for vaccine development.

The applications are almost endless, especially with modern applications that put a priority on connecting data across an organization, whether that’s application data from ERP or human capital management (HCM) systems, social media interactions or third-party data. This helps explain why Gartner has selected graph technology as one of its top 10 data and analytics trends the past three years running.
Graph analytics requires a database that can support graph formats. This could be a dedicated graph database or a converged database that supports multiple data models, including graph. Both will let you perform “traversal queries” based on connections and apply graph algorithms to find patterns, paths, communities, influencers, single points of failure and other relationships. Graph algorithms explore the paths and distance between the vertices, the importance of the vertices and clustering of the vertices. To determine importance, for example, algorithms will often look at incoming edges, importance of neighboring vertices and other indicators.
Let’s look at some use cases from “What is a Graph Database,” written by product managers in the Oracle graph team:
Six Degrees of Kevin Bacon
The image below shows a visual representation of the popular party game “Six Degrees of Kevin Bacon.” For those new to it, this game involves coming up with connections between Kevin Bacon and another actor based on a chain of mutual films. This emphasis on relationships makes it an ideal way to demonstrate graph analytics.
Imagine a data set with two categories of nodes: every film ever made and every actor who has been in those films. Then, using graph technology, we run a query asking to connect Kevin Bacon to Muppet icon Miss Piggy. The result would be as follows:
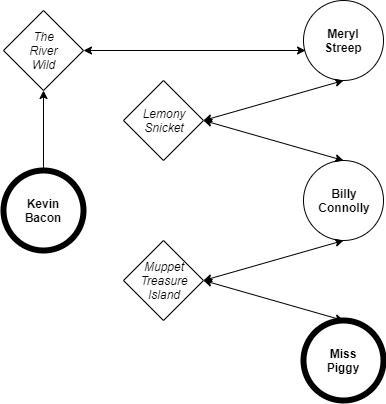
In this example, the available nodes (vertices) are both actors and films, and the relationships (edges) are the status of “acted in.” From here, the query returns the following results:
- Kevin Bacon acted in “The River Wild” with Meryl Streep.
- Meryl Streep acted in Lemony Snicket’s “A Series of Unfortunate Events” with Billy Connolly.
- Billy Connolly acted in “Muppet Treasure Island” with Miss Piggy.
Graph databases make it possible to query many different relationships for this Kevin Bacon example, such as:
- “What is the shortest chain to connect Kevin Bacon to Miss Piggy?” (shortest path analysis, as used in the Six Degrees game above).
- “Who has worked with the largest number of actors?” (degree centrality).
- “What is the average distance between Kevin Bacon and all other actors?” (closeness centrality).
Money Laundering
Conceptually, money laundering is simple. Dirty money is passed around to blend it with legitimate funds and then turned into hard assets. This is the kind of process that was used in the Panama Papers analysis.
More specifically, a circular money transfer involves a criminal who sends large amounts of fraudulently obtained money to himself or herself but hides it through a long and complex series of valid transfers between “normal” accounts. These “normal” accounts are actually accounts created with synthetic identities. They typically share certain similar information because they are generated from stolen identities (email addresses, addresses, etc.). It’s this related information that makes graph analysis such a good fit to make the synthetic identities reveal their fraudulent origins.
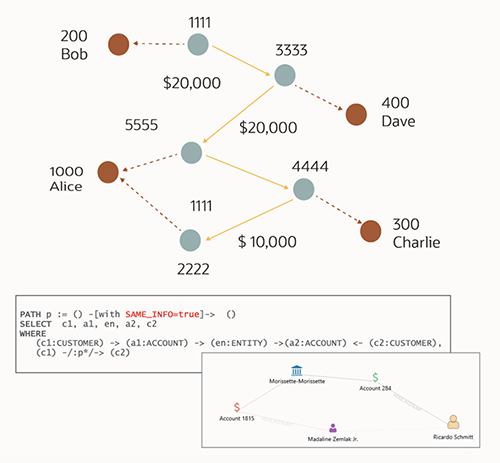
To make fraud detection simpler, users can create a graph from transactions between entities as well as entities that share some information, including the email addresses, passwords, addresses and more. Once a graph is created, running a simple query will find all customers with accounts who have similar information and are sending money to each other.
Social Media Analysis
Social networks make the ideal use case, as they involve a heavy volume of nodes (user accounts) and multi-dimensional connections (engagements in many different directions). A graph analysis for a social network can determine:
- How active are users? (number of nodes)
- Which users have the most influence? (density of connections)
- Who has the most two-way engagement? (direction and density of connections)
However, this information is useless if it has been unnaturally skewed by bots. Fortunately, graph analytics can provide an excellent means for identifying and filtering out bots.

In a real-world use case, the Oracle team used Oracle Marketing Cloud to evaluate social media advertising and traction, specifically, to identify fake bot accounts that skewed data. The most common behavior by these bots involved retweet target accounts, thus artificially inflating their popularity. A simple pattern analysis allowed us to identify these fake accounts using retweet count and density of connections to neighbors. Naturally popular accounts showed different relationships with neighbors compared to bot-driven accounts.
The key here is using the power of graph analytics to identify a natural pattern versus a bot pattern. From there, it’s as simple as filtering out those accounts, although it’s also possible to dig deeper to examine, say, the relationship between bots and retweeted accounts.
Social media networks do their best to eliminate bot accounts because they affect the overall user base experience. To verify that this process of bot detection was accurate, flagged accounts were checked after a month. The results were as follows:
- Suspended: 89%
- Deleted: 2.2%
- Still active: 8.8%
This extremely high percentage of punished accounts (91.2%) showed the accuracy of both pattern identification and the cleansing process. This would have taken significantly longer in a standard tabular database, but with graph analytics, it’s possible to identify complex patterns quickly.
Check out Oracle’s “What is a Graph Database” page for more details and use cases, including credit card fraud.
Graph at Oracle
If a graph database is part of a converged database offering, it eliminates the need to set up a separate database and move data. It also lends to the graph database all the enterprise-grade security and other infrastructure put in place to support large data workloads. Meanwhile, the graph database is within easy reach of application data.
“Graphs complement relational technology and can become the basis for machine learning, especially with neural networks,” says Oracle’s Sherry Tiao in her blog post, “Graph Databases: What Can They Do?” In the post, Sherry lists more applications of graph databases and talks in-depth about how Oracle graph databases work. Sherry also provides links to labs where you can practice analyzing, querying and visualizing with graphs, and another on how to build a real-time recommendation engine using graphs.
InApps Technology is a wholly owned subsidiary of Insight Partners, an investor in the following companies mentioned in this article: Island.
Lead image via Pixabay.


