


Kibana is a great analysis and visualization tool. But just like any piece of software, it is not perfect. While there is no doubt that the more recent versions of Kibana, 5.x and more so — 6.x, have made huge progress from a UI and UX perspective, there are some small missing bits and pieces that can make monitoring and troubleshooting a tad cumbersome.
One of these issues is the simple yet basic ability to insert links in a Kibana dashboard, and there is surprisingly no built-in mechanism to do so. The good news is that this feature is in development. Or at least seems to be in development. The bad news is that until the good folks at Elastic push this into production, it’s up to us to hack a solution.
1: Using Markdown
One workaround involves using a Markdown visualization. In fact, this is the most common method employed by users. URLs in markdown can be a bit funky because of the rendering of parentheses.
A method that works is using this format:
|
1
2
3
|
[Hello world!][1]
[1]: https://logz.io
|
While this is doable, this workaround is far from ideal from a usability perspective. When monitoring your environment and viewing a dashboard, a more natural workflow is to click a link from a specific field that opens another dashboard for further analysis and drill down.
2: Using URL formatting
Another workaround involved changing the format of a specific field to URL format. This requires a bit more work but the results are much more useful.
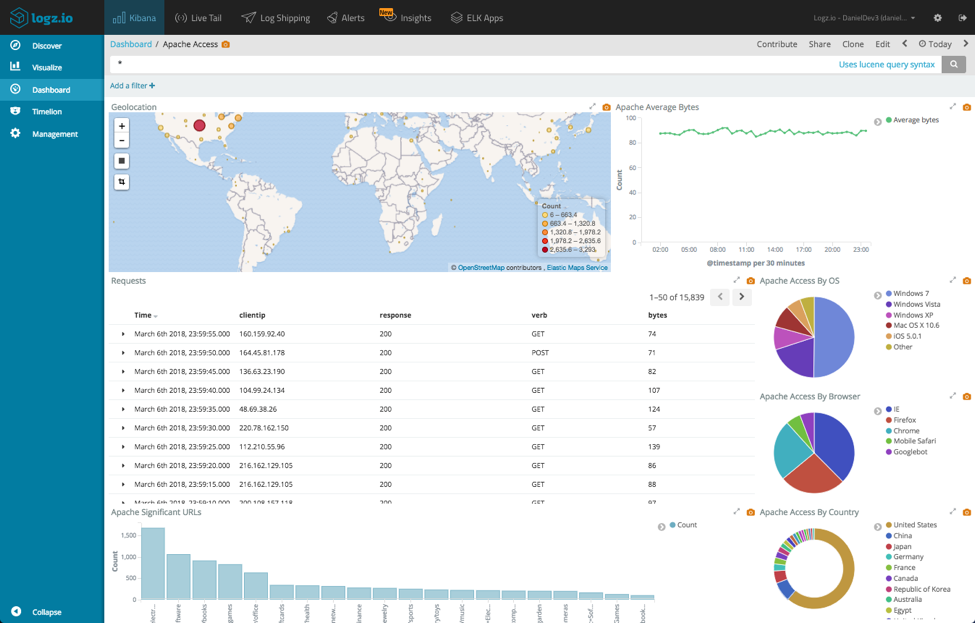
As an example, say I’m monitoring Apache access logs using a series of dashboards. One main dashboard gives me an overall view of all traffic and requests routed through my server:
Another dashboard is more specific, and is designed to drill down deeper into the IPs sending the requests:

Wouldn’t it be great if we could click on a specific IP in my main monitoring dashboard and analyze it further in my dedicated dashboard?
The first step is this second workaround is to retrieve a URL to use as the destination for the clientip field.
Opening our dedicated dashboard, I’m going to enter a specific query:
|
1
|
clientip:52.99.80.95
|

Next, I’m going to click on the Share button at the top of the page.
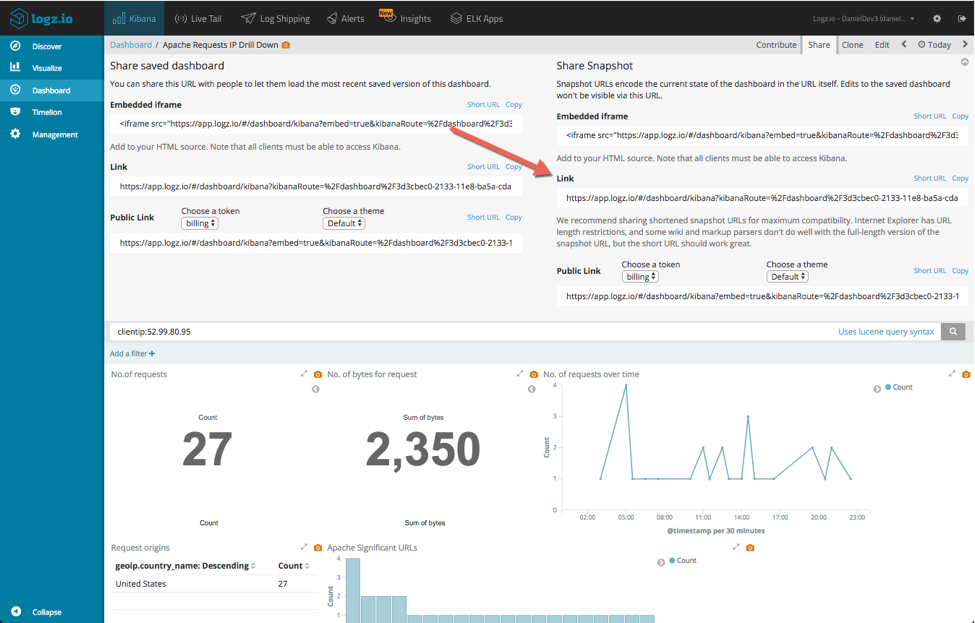
I’m then going to copy the Snapshot URL for sharing, and paste it in my text editor. The URL is quite long (depends on the objects in the dashboard), but what interests us at this stage is the query section.
In Kibana 5.x:
|
1
|
%2Cquery%3A(query_string%3A(query%3A%2527clientip%3A52.99.80.95%2527))
|
In Kibana 6.x:
|
1
|
query:(language:lucene,query:‘clientip:52.99.80.95’)
|
Within this string, we need to change the IP to {{value}} — a placeholder for the value of the clientip field.
In Kibana 5.x:
|
1
|
%2Cquery%3A(query_string%3A(query%3A%2527clientip%3A{{value}}%2527))
|
In Kibana 6.x:
|
1
|
query:(language:lucene,query:‘clientip:{{value}}’)
|
Make note of the entire amended URL.
Next, open the Index Patterns tab on the Management page and locate the field in question (in our case, clientip).

Click the edit icon on the right and enter the following settings:
- Format — open the drop-down menu and select URL
- Type — leave as “Link”
- URL Template — enter your saved URL
- Label Template — enter {{value}}
Click the Update Field button.

Open your main dashboard again — lo and behold, our IPs are now hyperlinked:

Clicking on one of the IPs will open our dedicated dashboard, with the relevant Kibana query filtering it:

Endnotes
The examples and screenshots above were used with Logz.io’s hosted ELK stack, but you can, of course, perform the exact same process with your own deployment.
Kibana holds plenty of tricks up its sleeve, so if you guys know of another workaround for inserting links in dashboards — I’d love to hear about it!
Happy linking!
Feature image via Pixabay.


