


As the executive in charge of customer success, I have perhaps the most intimate, on-the-ground understanding of how customers use our product and where they struggle. One request we have received time and again has been a better way to access system- and domain-level metrics and data to help optimize the resources and deployment of a NuoDB implementation.
That’s why I’m excited to introduce NuoDB Insights, now available with Linux versions of NuoDB 3.01 and higher. So without further ado, let’s cover the basics.
Why NuoDB Insights?

NuoDB Insights was developed to optimize database operations and system configuration. With NuoDB Insights, you can better:
- Assess the health of your NuoDB configuration over time
- Identify usage patterns and adjust configuration as needed
- Understand hardware utilization to ensure the correct operating environment
To accomplish that, NuoDB Insights was designed and built with two main goals in mind:
- Provide a single, standardized way to collect, share, and act on monitoring data from a NuoDB configuration
- Enable integration with existing monitoring frameworks
Through Insights, database administrators (DBAs) and operations teams get a single aggregated view of a NuoDB Domain and its physical environment (memory, disk, networking) no matter where they run. A NuoDB Domain is a collection of NuoDB hosts that have been provisioned to work together to support NuoDB processes. NuoDB Insights provides visibility into system health, issue identification and resolution, capacity management, and performance management. The tool enables automation of tasks, such as notifications and lifecycle management of a NuoDB configuration.
What does NuoDB Insights do?
Specifically, NuoDB Insights collects relevant data from the NuoDB database and systems environment and provides time series metrics and event monitoring data to give DBAs and operations teams visibility and control of a NuoDB Domain. NuoDB Insights is turned OFF by default and must be turned on before it starts collecting data. Instructions on how to do so can be found here.
NuoDB Insights Components
NuoDB Insights consists of three logical elements: collect, share, and act. The foundation of Insights, NuoDB Collection Agent (NuoCA) is a process that runs on each NuoDB node and gathers near real-time monitoring and event data on NuoDB and the system it runs on.

Insights Logical breakdown
NuoCA augments data it collects from NuoDB processes and logfiles with system data collected using the open source monitoring tool Zabbix. Among the data collected are life cycle events (starting and stopping of processes), domain information, and data from the NuoDB the SQListener information to get details on the work in the system.
NuoCA is a pipeline architecture with three distinct stages: Input, Transform, Output. Information is collected by the input stage, then flows to the Transform stage, then flows to the Output stage. NuoCA also has a flexible plugin architecture. Plugins types are “input,” “transform” or “output.” Insights plug-ins have an open architecture, making it possible for anyone to extend the system with additional transformation or integration plug-ins by adding to the NuoCA project on GitHub.
NuoCA can send the monitoring data to different destinations via different communication methods. NuoCA output can be stored on-premises or sent to a hosted service. Standard communication using HTTP and https connections are supported, but alternative options including Elasticsearch and Kafka publisher are also provided.
By supporting standards-based communication, NuoCA allows integration with existing monitoring and management tools such as SUMO Logic, CA Application Performance Management, or SolarWinds. Those tools provide facilities to analyze, visualize, and act on the data.
Additionally, the data can be sent to any time series engines, such as ElasticSearch or InfluxDB for further analysis and action. Once stored, the data can be accessed with many tools, for example, to generate dashboards, network diagrams and so forth. NuoDB offers a free, hosted service for monitoring data, using ElasticSearch and Grafana. Your unique URL for this dashboard is provided when Insights is enabled. The figure below shows an overview of the Insights components.

Insights Components
Below is an overview of the default NuoDB Insights dashboard. The examples below discuss the systems configuration, details on SQL operations, and system resources.
Configuration
NuoDB Insights provides an aggregate view of a running NuoDB configuration mapped in time. Active configuration data helps in gaining control of the lifecycle management in the cloud and on-premise. The data points can be used to assess the health of the configuration, identify usage patterns, and adjust it where needed.
The illustration below shows a view of a NuoDB Domain running two Transaction Engines (TEs) and two Storage Managers (SMs); this is a redundant configuration that will continue to operate even when (for example) an SM is stopped. When information on location is provided, you can see where the machines are running: for example, in your data center and in a cloud environment such as AWS. The line at the bottom of the graph (2) shows that the configuration has been unchanged for the last seven days (3). The dashboard allows you to zoom in and out on the timeline to get a general overview or very detailed data over time.
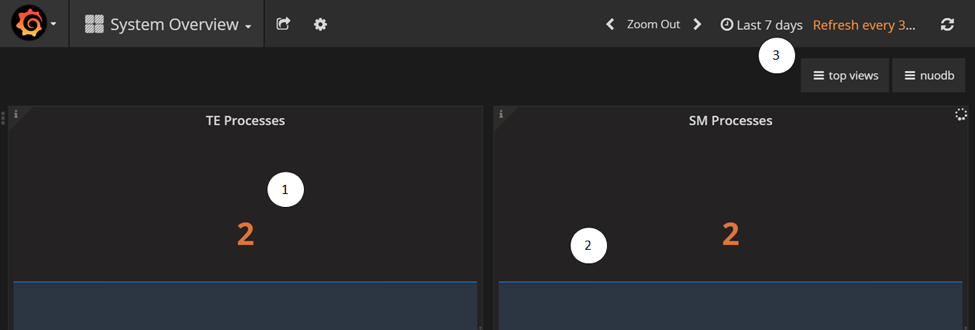
Configuration
Database Activity
The graph below shows a more detailed view of what work the database is doing. The panel shows the number of database commits for all system processes. At this time only node 4, a TE, is performing work, processing about 60 commits per second.
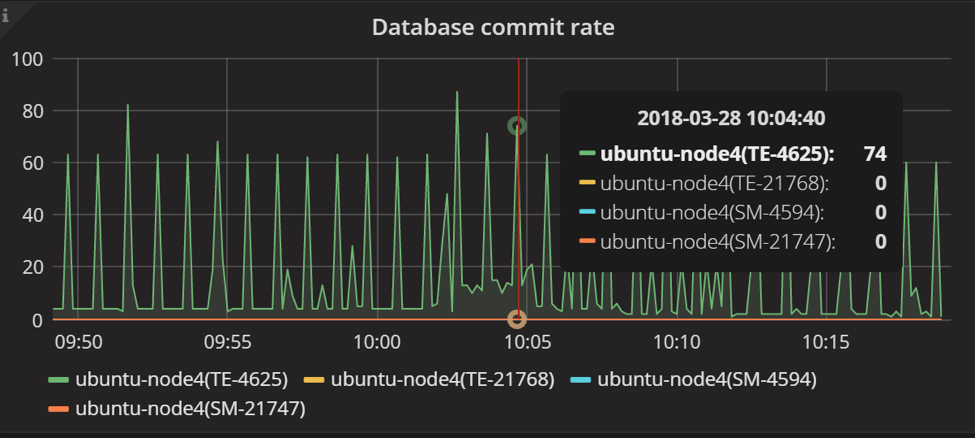
Database commit rate
The database activity shown below is generated by 93 client connections, across two TEs. The connections to the processes have been stable over time, but are skewed; one TE has 80 of the 93 connections. This configuration works well, however, typically you’d be looking for a more balanced distribution of connections across TEs.
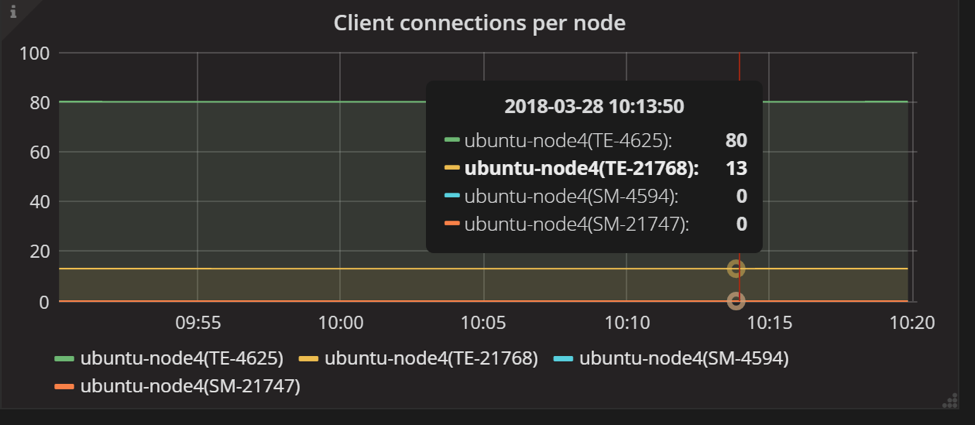
Client Connections
NuoDB Insights is set up to capture NuoDB-specific data, yet generic enough to enrich it with application-provided data for a complete view. Collecting application data points can be done by having the application write data to a log file, and then configure the NuoCA LogStash Input Plugin to collect from that log file in near real time.
System
NuoDB Insights also helps to understand the utilization of hardware infrastructure components such as CPU, memory, and disk. These data points are collected to help to ensure the correct operating environment for the solution. Key metrics such as disk capacity, memory usage, and CPU consumption are collected.
The graph below displays the CPU usage of a particular node, a TE, for a 25 minute time interval. Typically the performance from a TE is CPU-bound. The data shows that the TE CPU consumption has few fluctuations, and there’s available capacity to do more work.
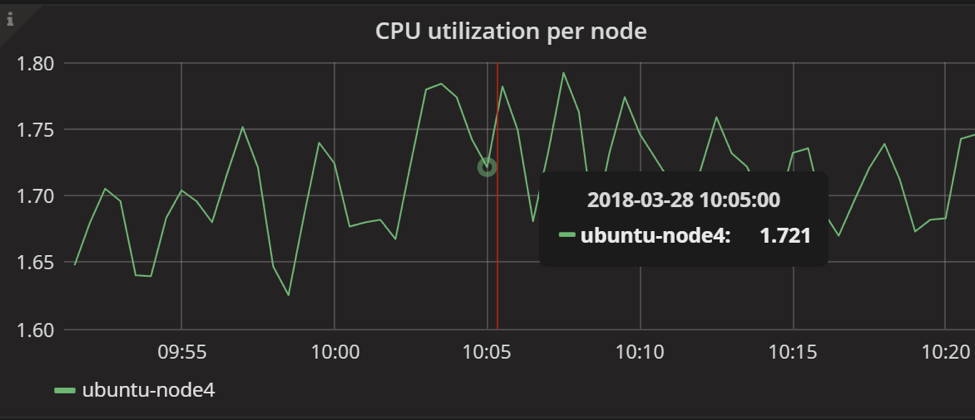
CPU Usage
The graph below shows the memory used by the same TE, over the same timeframe. Memory usage for the node shows little variation providing another data point that the use of system resources is within an acceptable range.
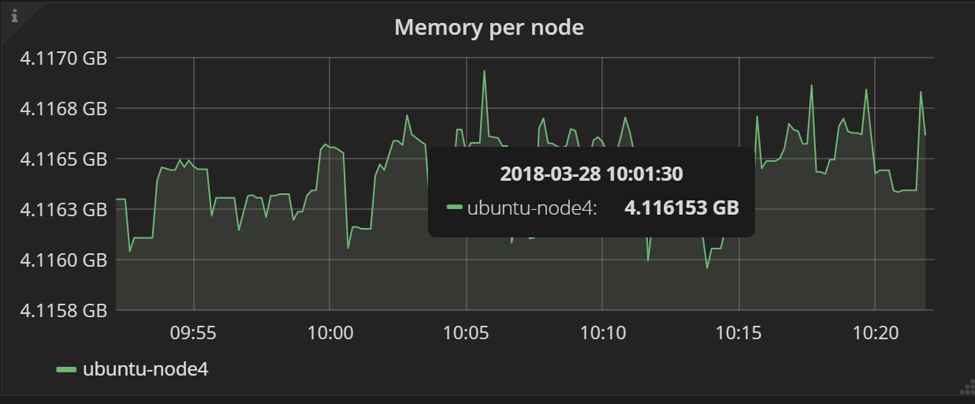
Memory Usage
Viewing system data points such as CPU consumption and memory usage complements alerts from the database to help to assess if the hardware configuration supports a healthy environment for NuoDB.
Summary
Distributed systems such as NuoDB increase the need for aggregated monitoring data to give DBAs and operations team visibility in — and control over — a configuration. NuoDB Insights provides a standard way to collect, share, and act on monitoring from NuoDB. Insights can integrate with existing monitoring tools and provides an open architecture to add additional integration points using plug-ins. The dashboard discussed in this article only shows a small part of the data that is collected by NuoCA, In upcoming releases, we’ll add information on the database activity (TPS, rollbacks, inserts, updates), system data points, and communication data.


